The Main Page
The Pelican Web-App is your birds eye view into the active temperatures and HVAC equipment statuses through-out a commercial facility. It allows for real-time adjustments over all aspects of the indoor climate and their related systems. As shown below, the Main Page of your app is sectioned by color coordinated buttons for quick and easy navigation.
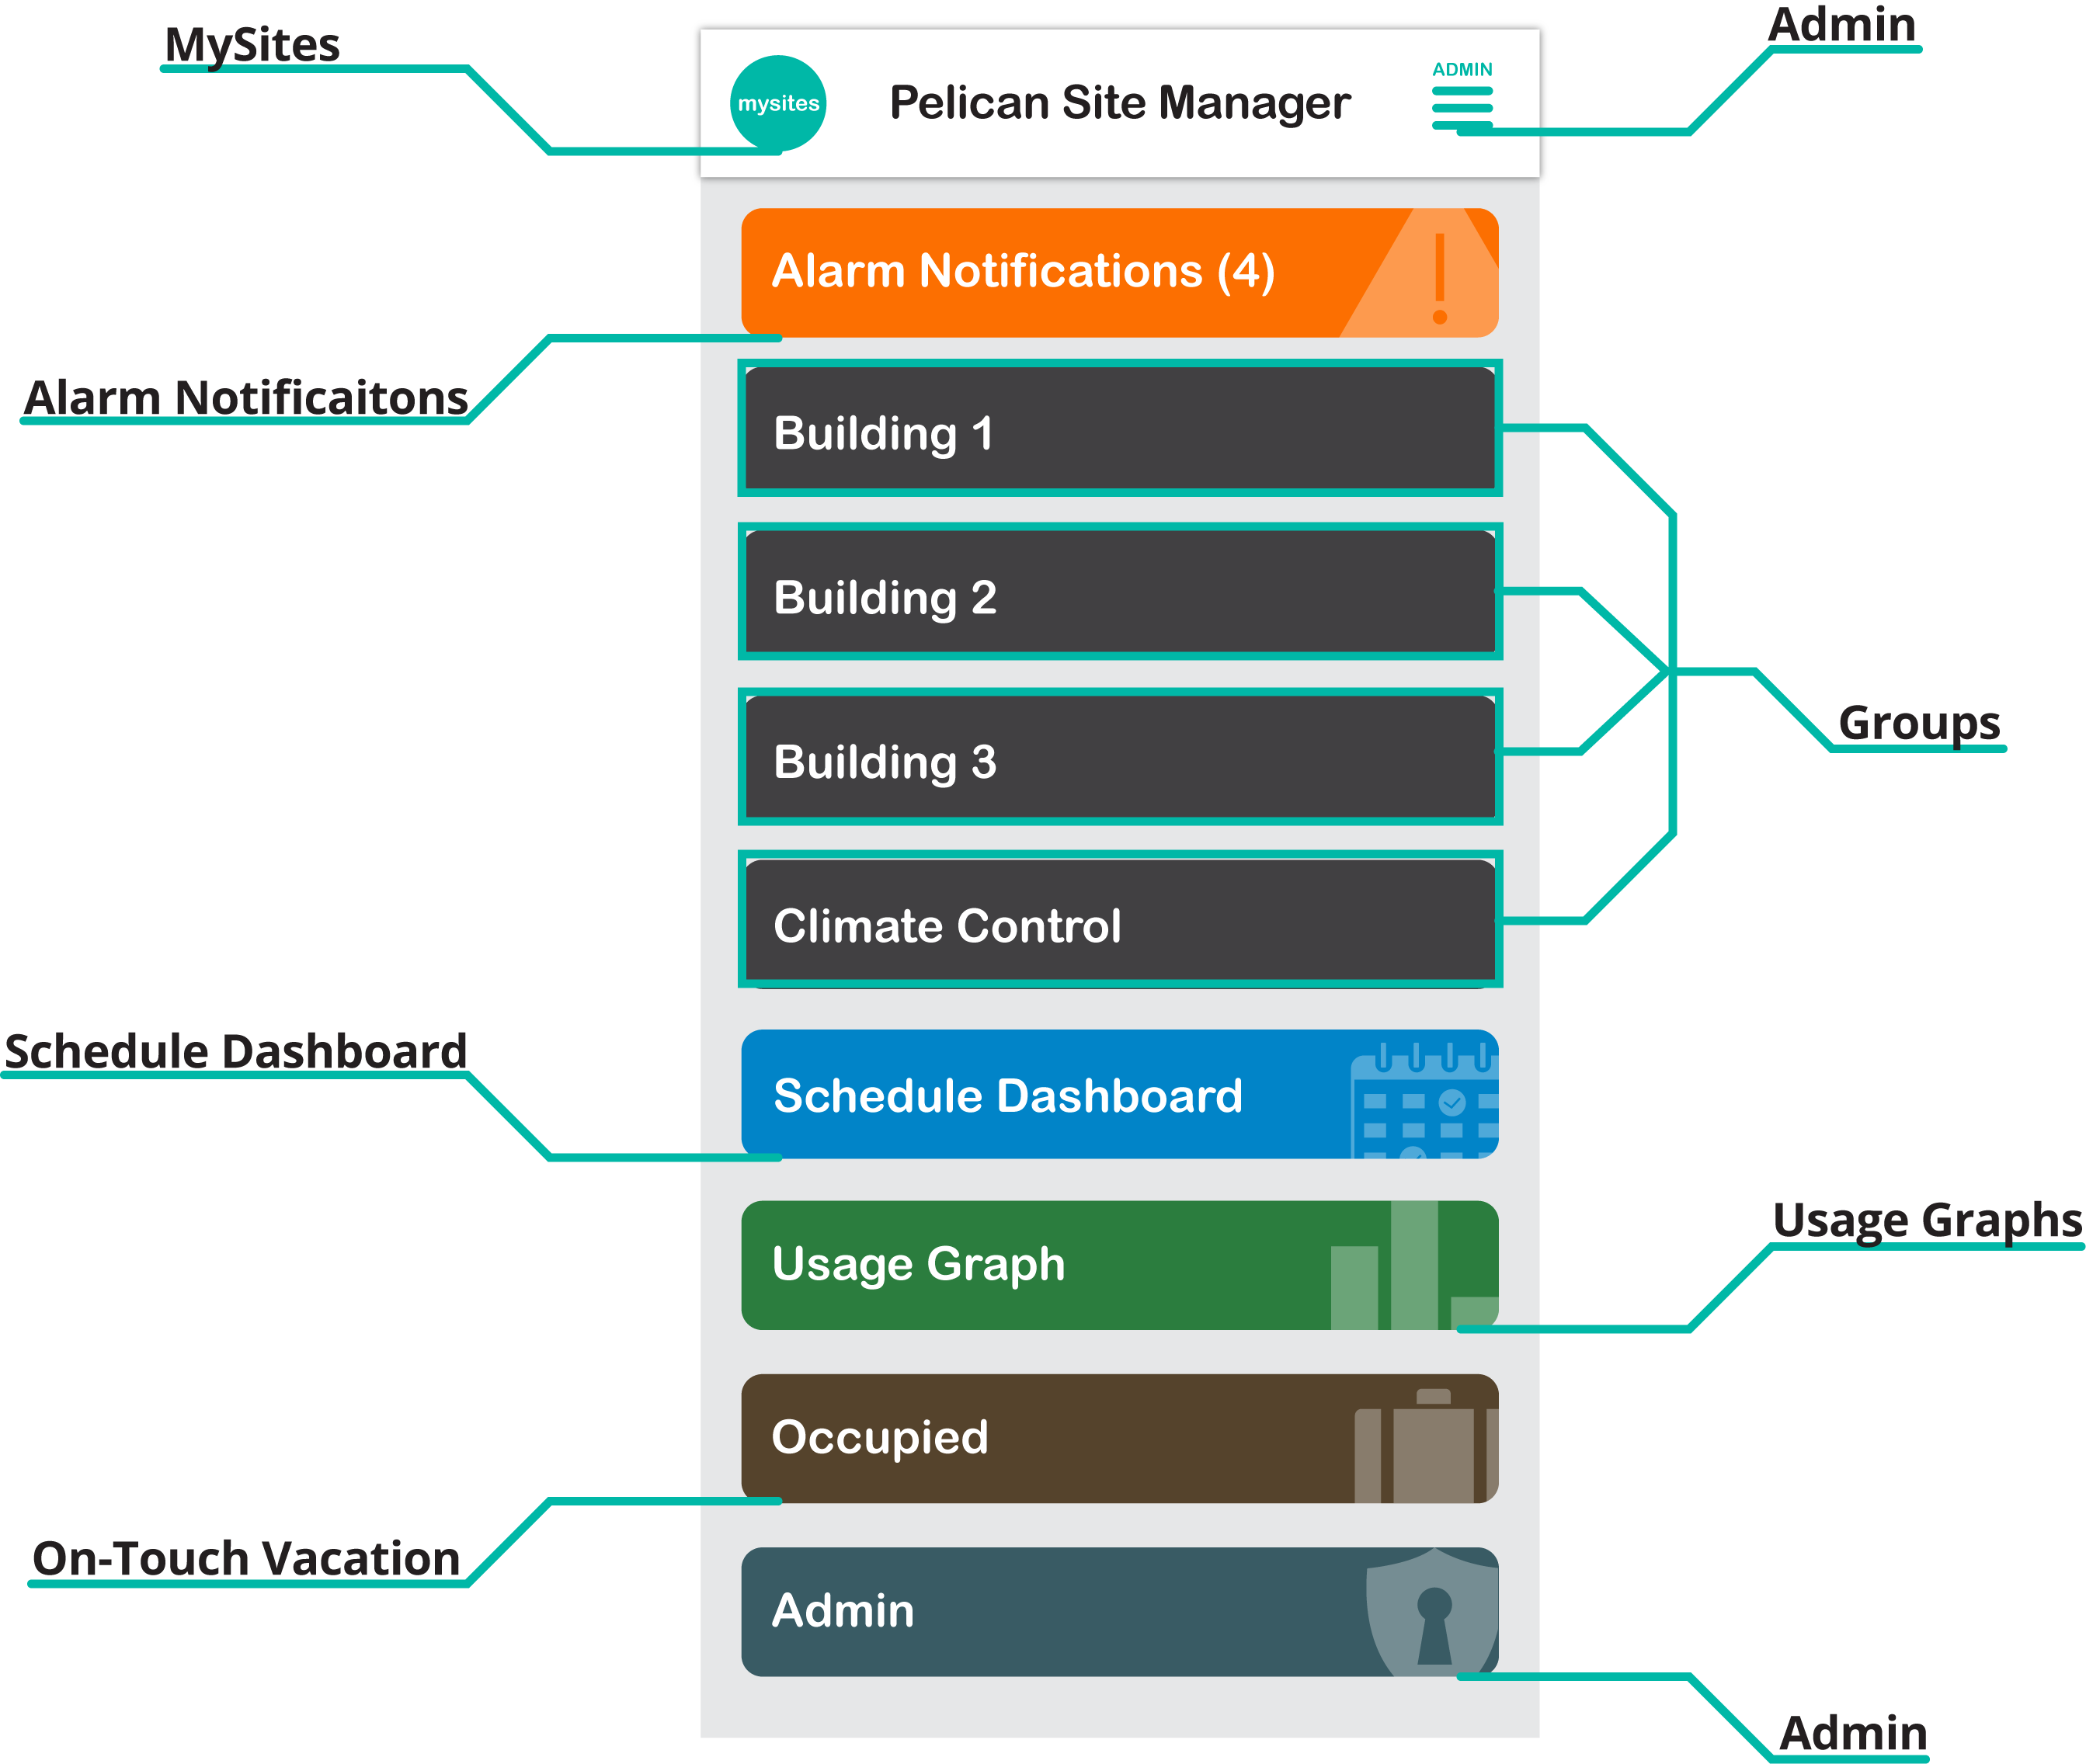
The viewable parts of the app automatically adjusts based on the Access Rights you have within the solution. Navigating these different section of the app are further explored through-out this Help guide.
Related Sections:
- MySites Portal
- Understanding Alarm Notifications
- Managing Individual Rooms
- The Schedule Dashboard
- Understanding Usage Graphs
- Vacation Schedule Management
- Web-App Administrative
Rooms
Rooms are grouped in the Pelican app to help you quickly navigate through a building or a multi-building campus. Rooms will be grouped by floor, tenant names, building names, or similar and the default group is Climate Control. Groups are displayed as dark gray buttons on the Main Page of the app.
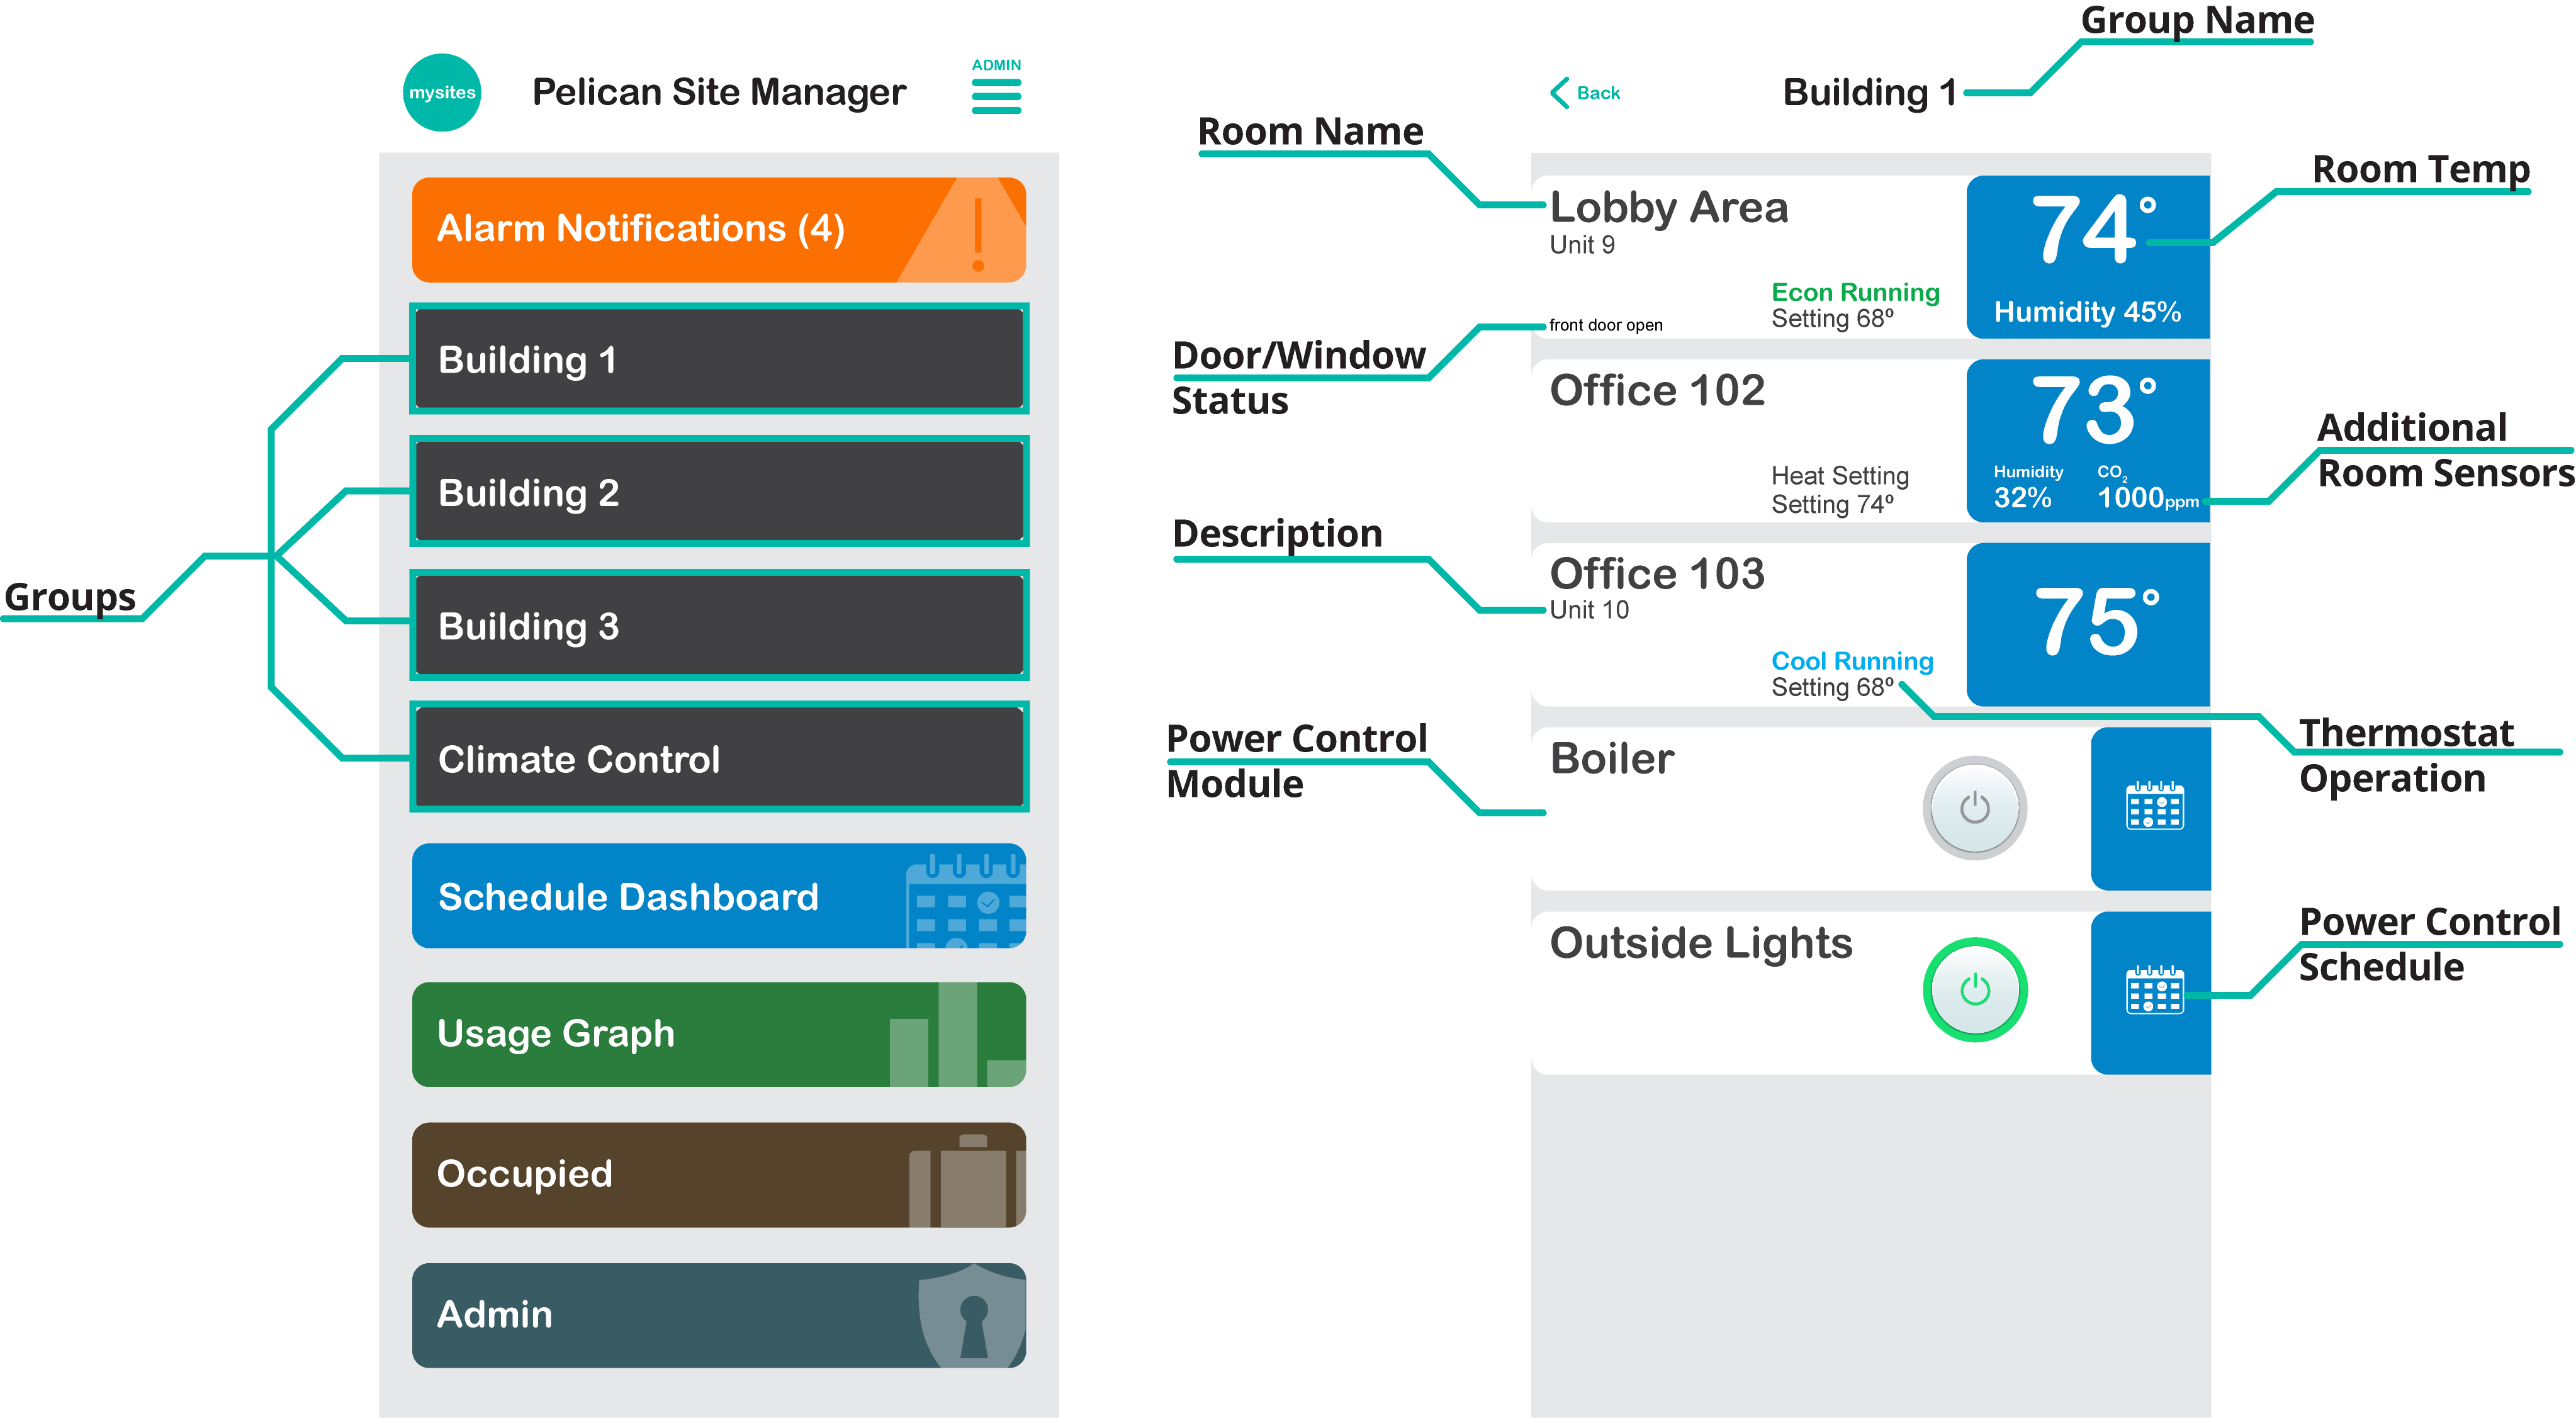
To view individual room statuses , select one of the groups. To get to a room’s climate control page, click the room you want to make adjustments too.
All the different room information on a group page:
Related Sections:
- Understanding Room Status Indicators
- Managing Individual Rooms
- Understanding Carbon Dioxide (CO2) Levels
- Understanding Relative Humidity (RH) Levels
- Managing Door/Window Sensors
- Managing Occupancy Sensors
- Thermostat Configurations
- Introduction to Power Control Modules
- Scheduling Power Control Modules
Schedule Dashboard
The Schedule Dashboard provides a convenient area to manage all Occupied/Unoccupied and Special Event schedules for all your room thermostats. The dashboard is accessed by selecting the blue button labeled Schedule Dashboard on the Main Page of your app.
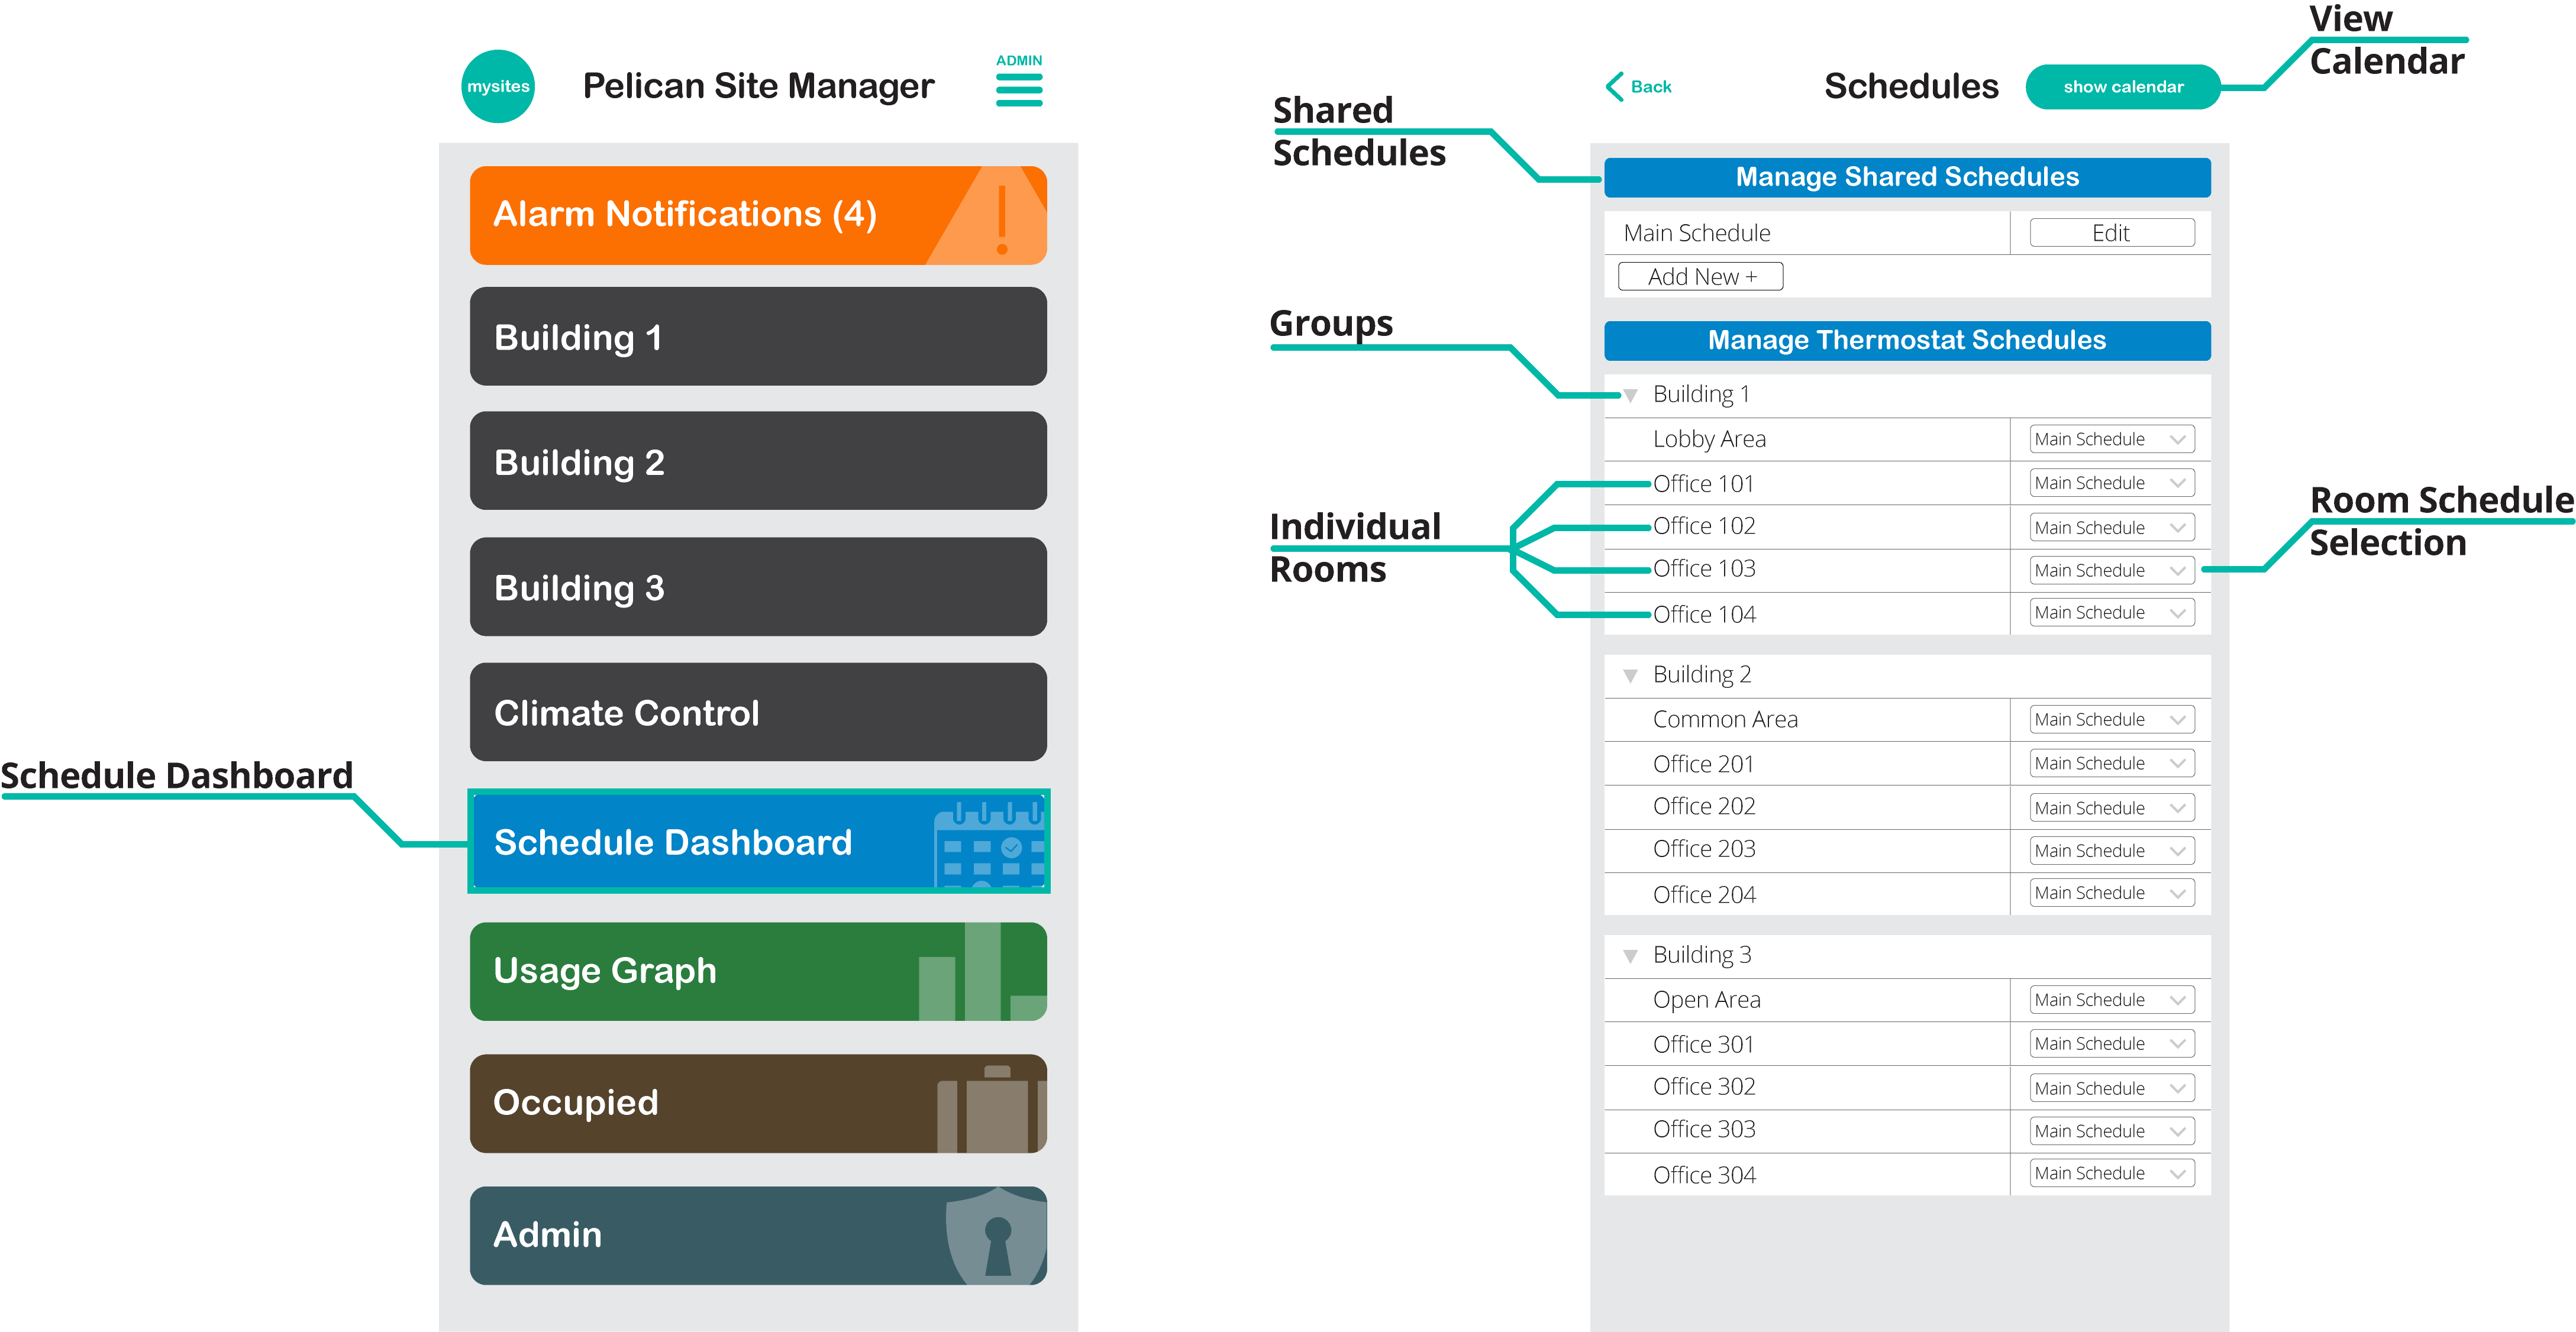
The Schedule Dashboard is segmented into three primary sections:
- Manage Shared Schedules provides an area where you can create schedules that are shareable between multiple room thermostats.
- Manage Thermostat Schedules allows you to view current room schedules and/or apply shareable schedules to room thermostats or manage their individual customer schedules.
- Show Calendar provides a daily, weekly, or monthly calendar view of all your room thermostat’s Occupied/Unoccupied schedules as well as provides the ability to apply Special Event schedules to rooms.
Related Sections:
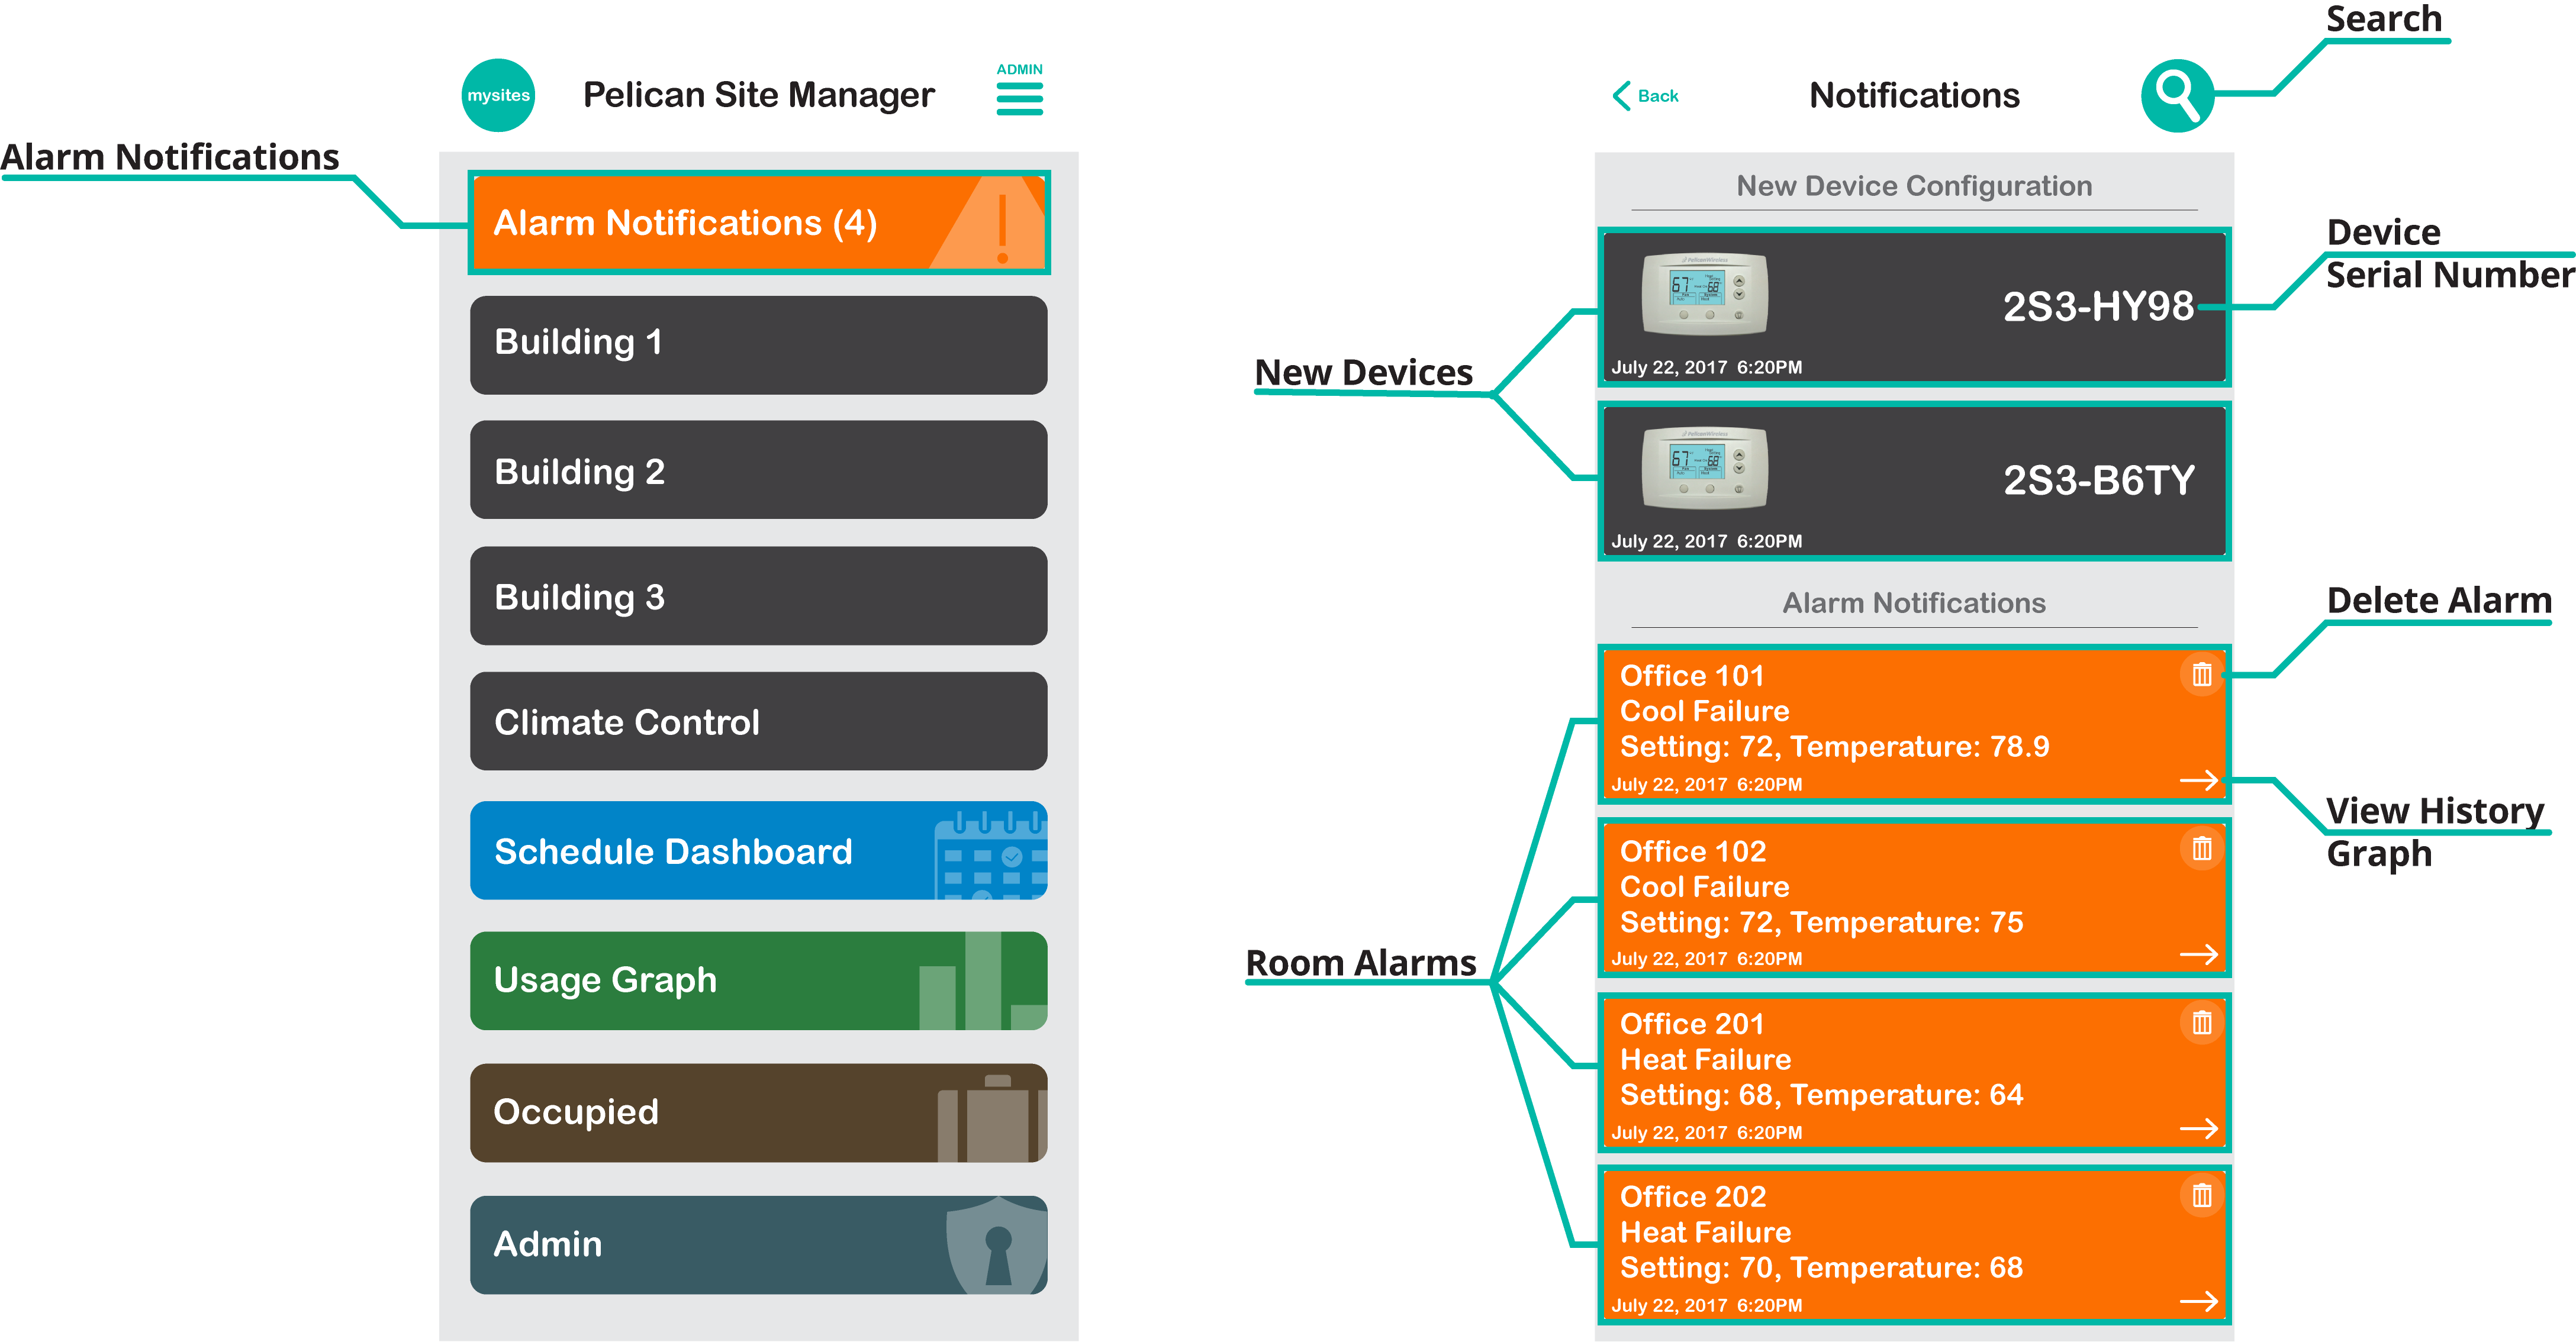
Notifications
Alarm Notification are accessed by selecting the orange button labeled Alarm Notifications on the Main Page of your app. This button will only be visible if there are active notifications.
There are two types of notificaitons:
- New Devices are notifications that identify when a new Pelican device has been installed at your site and needs to be configured.
- Climate Issues notifications are designed to identify mechanical issues and help you proactively identify where and when they occurred. These notifications are never an indication of a problem with your Pelican Solution. They are simply used to identify potential mechanical problems.
Related Sections:
Admin Menu
This Admin area provides access to all the administrative configurations for your Pelican Solution. The Admin Menu can be accessed by selecting the Admin icon in the upper right hand corner of the Main Page or by selecting the dark blue button labeled Admin at the bottom of the Main Page.
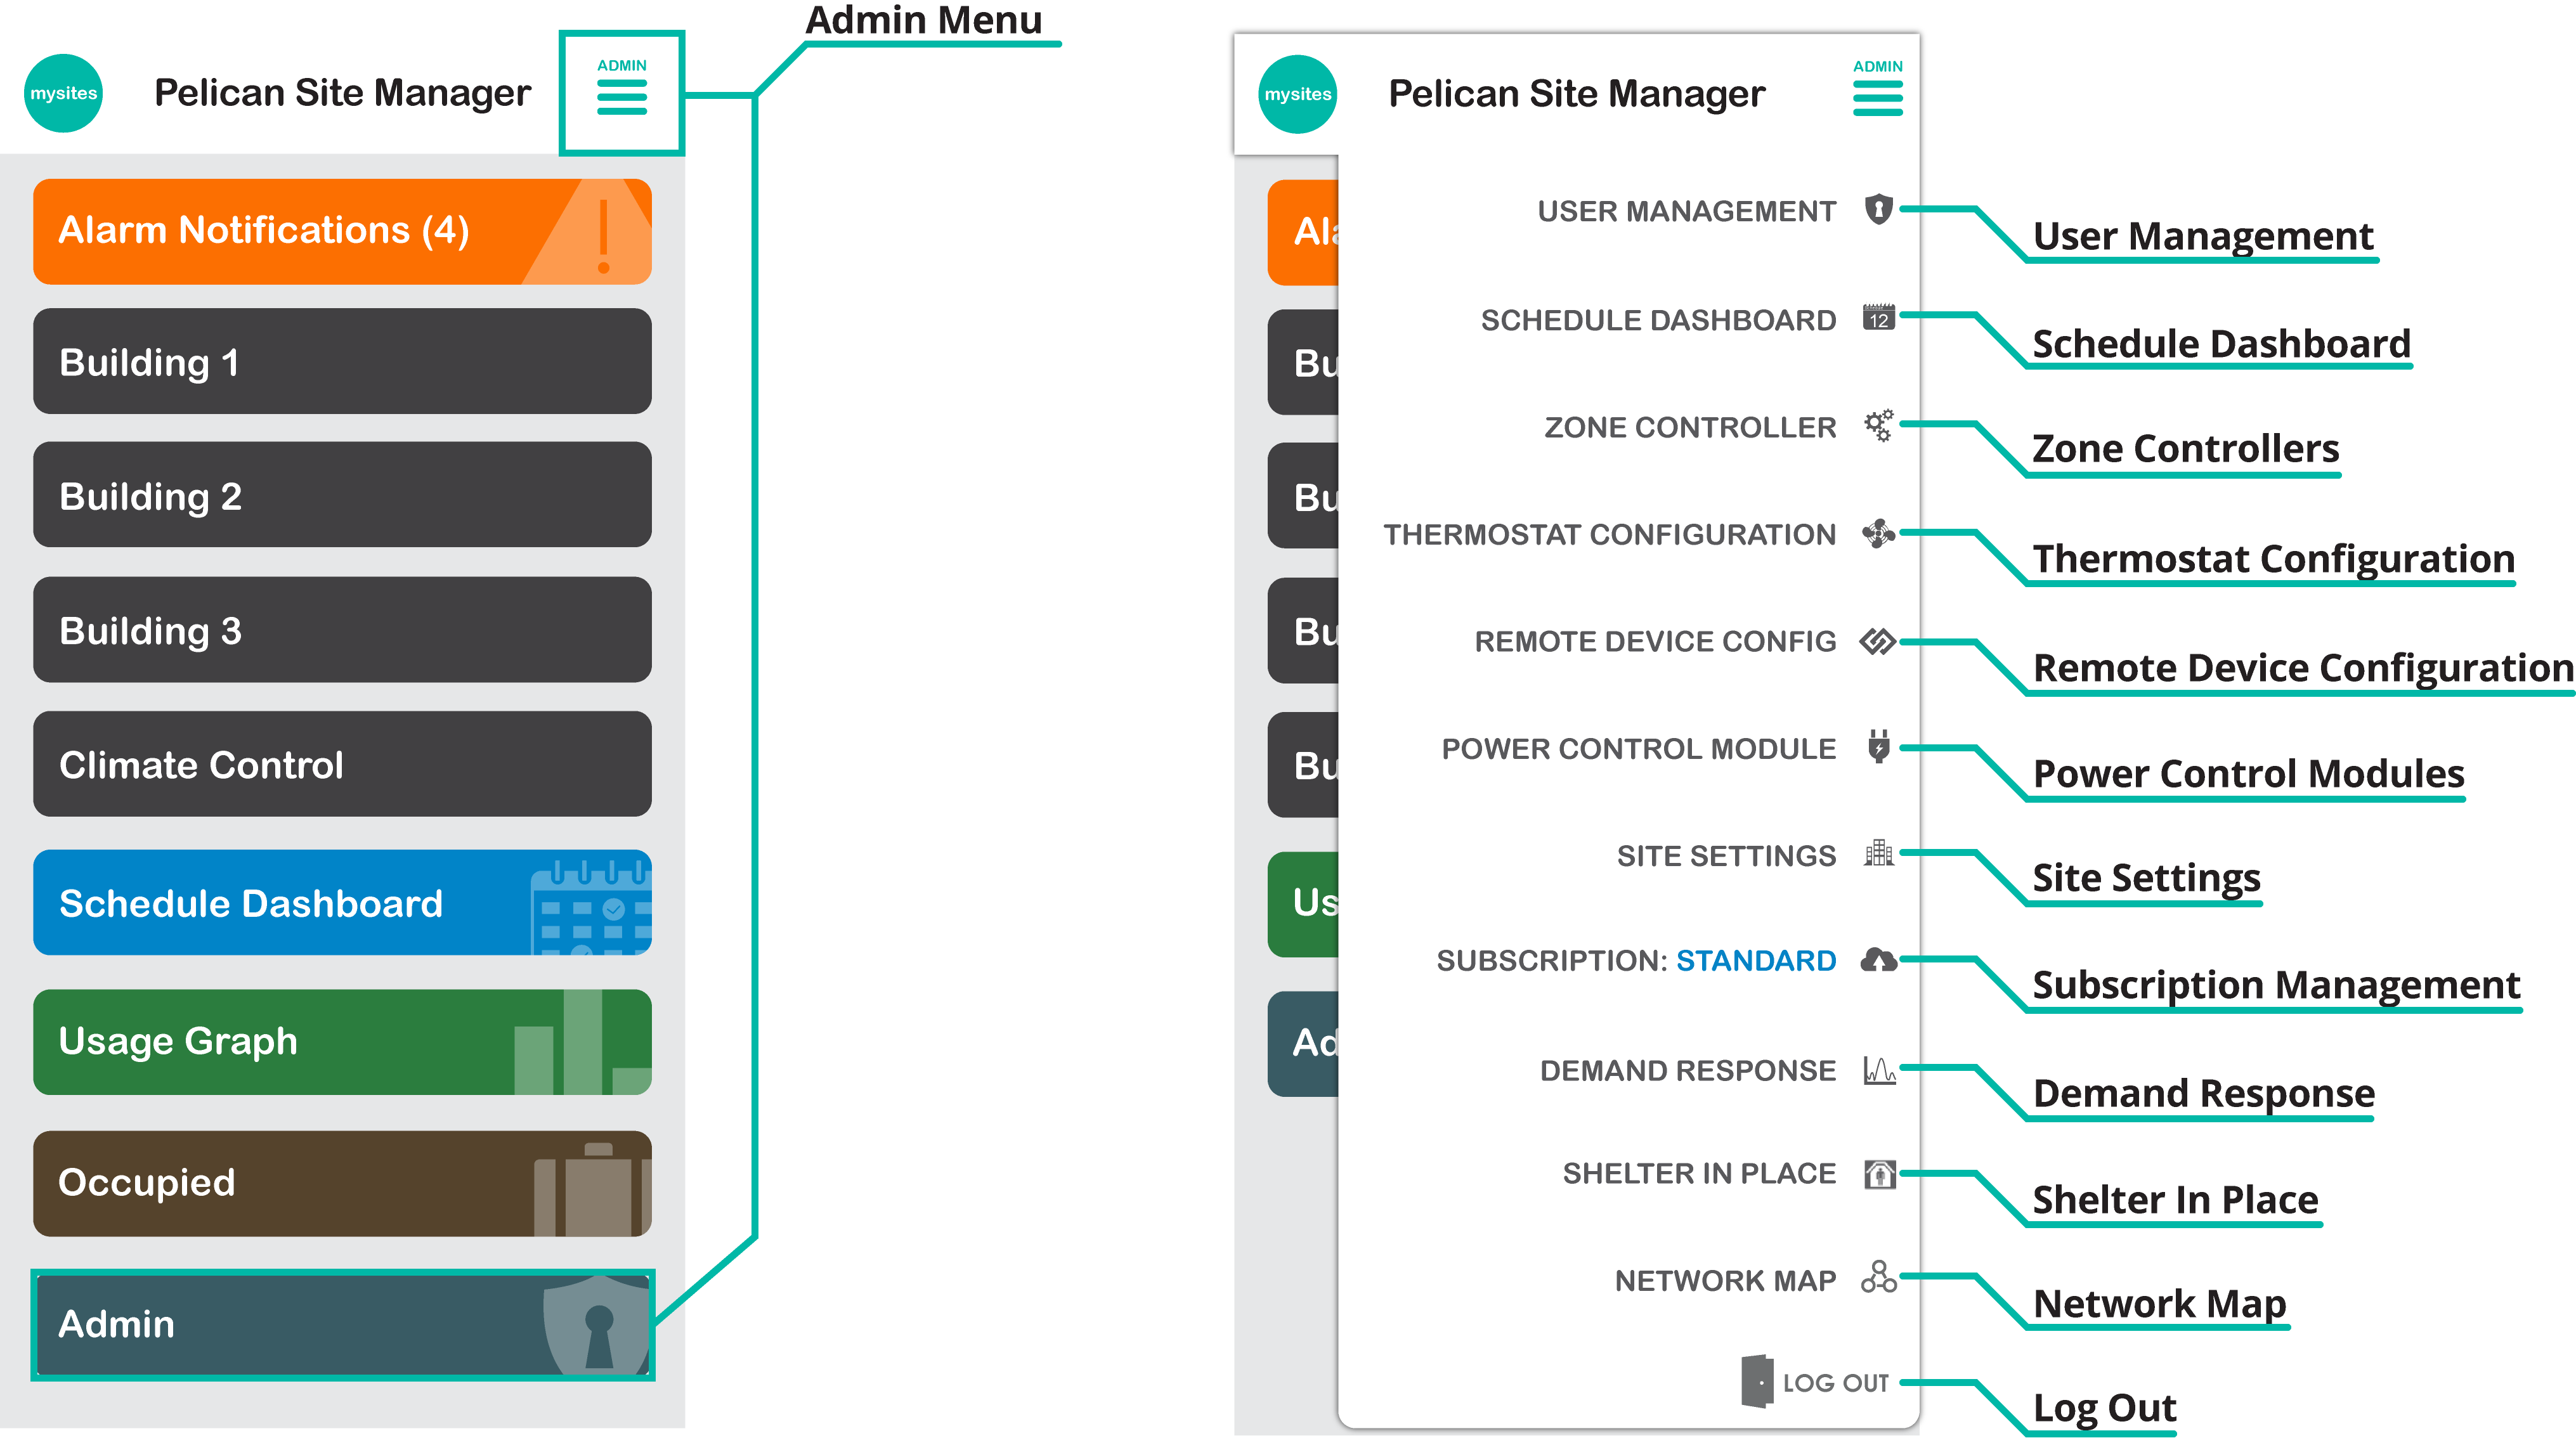
Related Sections:
- Managing User Access
- The Schedule Dashboard
- Device Configuration
- Site Settings
- Subscription Management
- Demand Response Programs
- Shelter-In-Place
- Network Map
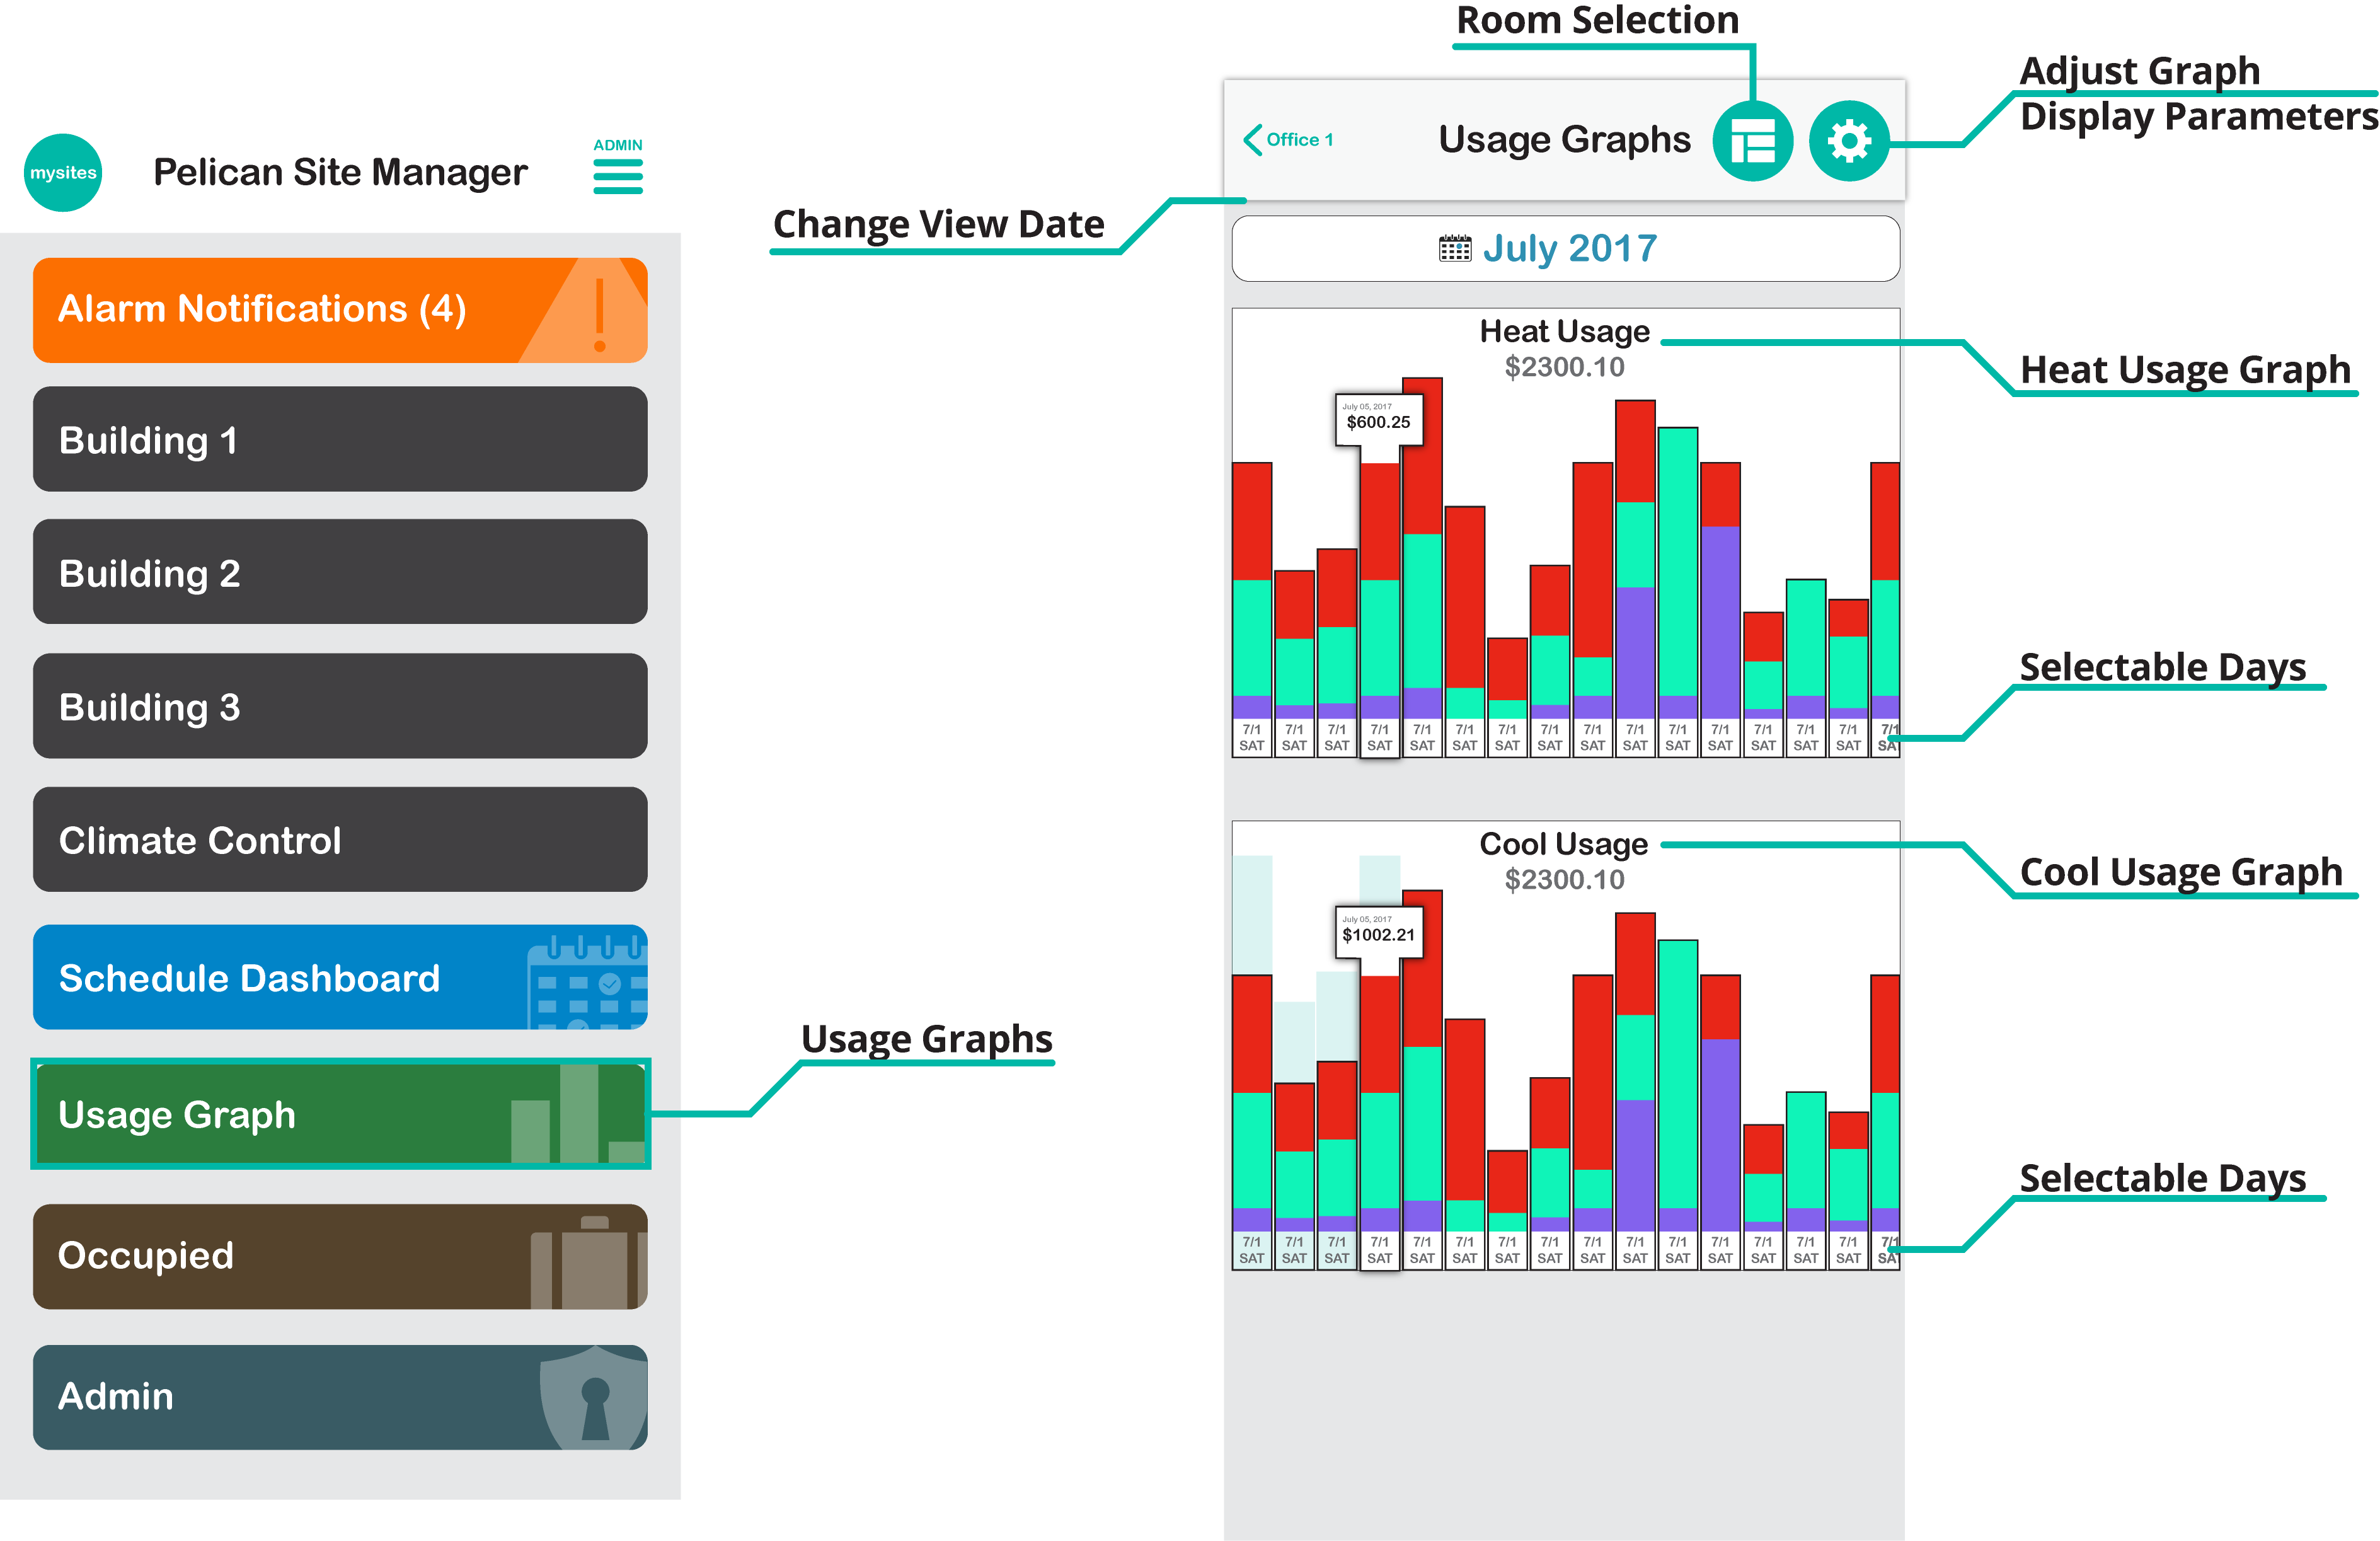
Usage Graphs
Usage Graph show historical cooling and heating run-time information and can also display calculated energy consumption and electric cost. Usage Graphs are accessed by selecting the green button labeled Usage Graphs on the Main Page of your app.
Related Sections:


